Spreadsheets aren’t infallible.
Take a glance at Major League Baseball. Stats like exit velocity, launch angles, and barrel rates dominate the conversation. Home Runs rule the roost.
There are unintended consequences to blind faith regarding data analytics. The game is dominated by Three True Outcomes. Walks, Strikeouts, and Home Runs.
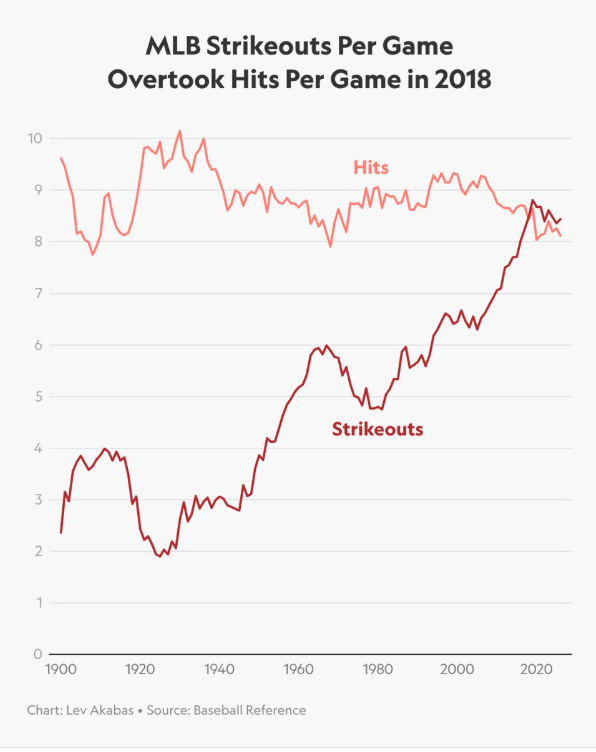
Since Homers are infrequent, we have a deluge of walks and especially strikeouts. In a game where not much happens, the lords of stats have increased nothingness exponentially.
Players are putting the ball in play with far less frequency. batting averages have plummeted. In 2007,the average player hit .268. now it’s closer to.240 Contact on balls in play BABIP are in a steady downward trajectory. This means even on the rare occasions players hit the ball, they’re turned into outs at historic rates.
Strikeouts over the same period elevated from around 6 per game to todays level of 9. In fact, during 1968, a year pitchers dominated due to a higher mound, the strikeout per plate appearance was 15.8%. In 2025 the level was 22.2% .
What’s lost in all this quest for the ultimate data is the effect on the game’s fans. people go to sporting vents to escape from reality and be entertained. When the majority of at bats end with no contact this is the antithesis of fun.
It’s not surprising , the NFL. a sport filled with bone-crushing violence and last second excitement has far surpassed baseball in terms of popularity. The NFL draft consistently garners higher ratings than Baseball’s World Series.
Fear not, MLB is still more exciting than political conventions and little kid’s experiences at church – For now.
The 80’s Punk Band, The Buzzcocks sang it best when describing a typical 2026 game, Boredom.
Data will never replace the power of human connection.
We often see these same mistakes in personal finance. The best financial plan is the one you will follow through on. Spreadsheets optimize for expected value assuming perfect discipline. Tossing to the curb factors like emotions risk tolerance and behavioral triggers because they don’t fit nicely on a spreadsheet is a dangerous game to play.
Three examples include:
- Debt avalanche vs debt snowball– The avalanche method of paying your highest interest rate debt first is mathematically optimal. This contradicts research which proves paying off your smallest debt first, the snowball method, gets people faster out debt. Never discount the power of quick wins to augment motivation for future progress.
- Paying off a low-interest mortgage vs. investing the difference– Most advisors will encourage investors with a 3-4% mortgage rate to not repay their debt and instead invest the difference in the stock market which historically averages between 7-10%. Mathematically this works. Emotionally not so much. Many people find peace in owning their home outright. This leads to better future behavior like not panic selling their stocks during downturns due to their feeling of increased security. Quality sleep isn’t a variable on a spreadsheet.
- Lump-sum investing vs. dollar-cost averaging (DCA)– Research proves investing a lump sum all at once beats spreading it out over months because markets go up more often than go down. What the studies don’t articulate is DCA lessens the emotional risk of investing before a crash and coping with massive regret. This may lead to appalling long term behavior effects, including avoiding investing all together in the future.
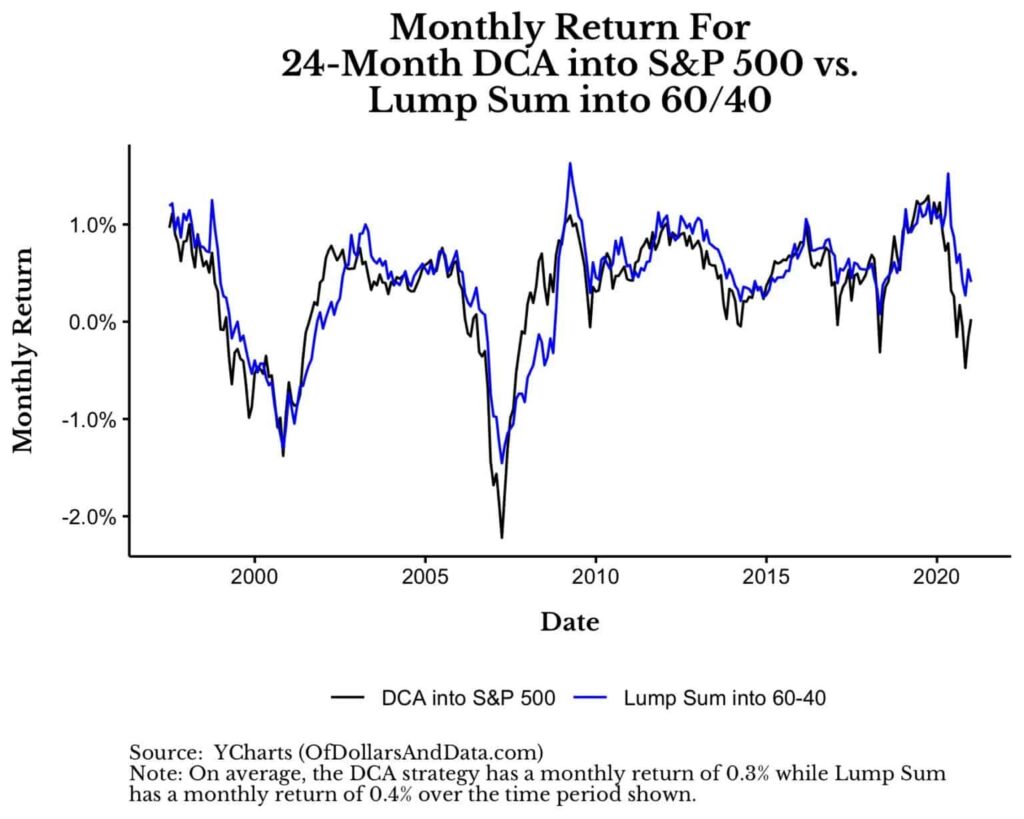
For investors a worse strategy they can adhere to far outweighs a better strategy they will be quick to pull the trigger on. Numbers in sports and personal finance can lie if they aren’t put into proper context.
Number nerds don’t know everything.