Some ratios matter more than others.
In finance investors tend to prefer things like Price to Sales or Price to Earnings ratios. Here is something more valuable to apply. It’s called the Work To Fun Ratio. I think I just invented it.
Here’s how it works. People tend to work many more years than the time they spend in healthy leisure.
Let me explain. There’s a humongous difference between health and lifespan. Being alive isn’t the same as living.
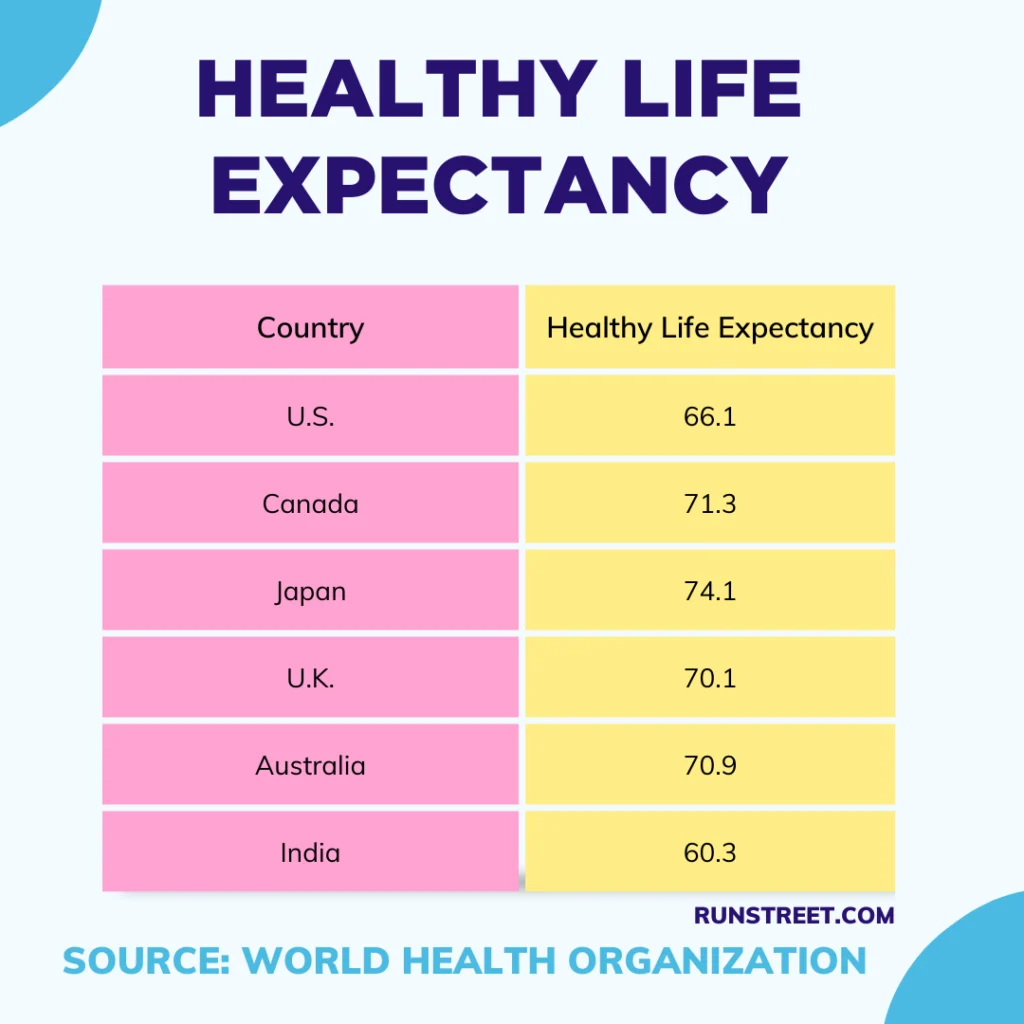
According to the British Office of National Statistics:
A healthy life expectancy (the years lived in good health without limiting illness or disability) ends much earlier. For someone who is 60 today, you’re looking at roughly 12-15 more years before health limitations start to intrude in meaningful ways.
In other words you probably have about 12 good years to play with.
If someone began work at the age of 20 and retired at 70, there’s a decent probability that they would only have about 2-5 years of decent health before things started to go south. Everyone’s different, and some people may maintain good health into their late 70’s to 80’s, others physical decline will be much earlier.
We can only go by probabilities so the 2-5 years is of good health is the number that’s most likely to occur after 70. Just like we can’t assume average returns of 20% for an investment portfolio, these figures are evidence, not fantasy based.
Doing the math gives you the following ratio. 50 years of work divided by 2-5 years of optimum health gives you and average W/F ratio of about 14. This means you have traded 14.3 years of work for one year of healthy fun.
Just like the P/E and P/S figures, the higher the numbers the worse the expected outcome. In this case we’re not discussing stock prices but a far more important matters that aren’t found on a spreadsheet.
Lets do another example, someone who begins work at 20 and retires at 62.
Take the 42 and divide it by 10-15 years of sound health and you come up with a W/F ratio of 3.4.
The lower number means less work and more fun. 3.4 years of work for every year of unimpeded fun is a far better deal if you can swing it.
Obviously there are several caveats to this ratio. If work is also fun to you, the high number is irrelevant and maybe even preferable.
If you haven’t saved or are the victim of unforeseen circumstances the low W/F ratio may be an impossible dream for your individual situation.
In addition your own family and current health history will effect the number of years you expect to be in good health. Anything can happen at any time but if you have chronic health conditions your W/F is already drastically low.
The numbers also vary between countries.
This post is geared toward specific undecided investors. Their characteristics include: healthy balance sheets, non-work related social connections, hobbies and passions, and disgust with the daily grind.
If you fall into this camp. take a good hard look at your personal W/F. Use the above examples as models for your own calculation. Adjust them to fit your individual profile.
Make sure to factor in front loading loading your retirement spending when making your decision.
Money is a ticket. Use it or lose it. If you believe 10 years of work for one year of healthy leisure is a fair trade, have at it.
IMHO sometimes the best bet is aiming lower.