https://player.acast.com/5fbe7dfb74be345c0b6fff2a/episodes/how-do-you-know-if-youre-saving-enough-for-retirement?theme=default&cover=1&latest=1
Who doesn’t want a prosperous retirement?
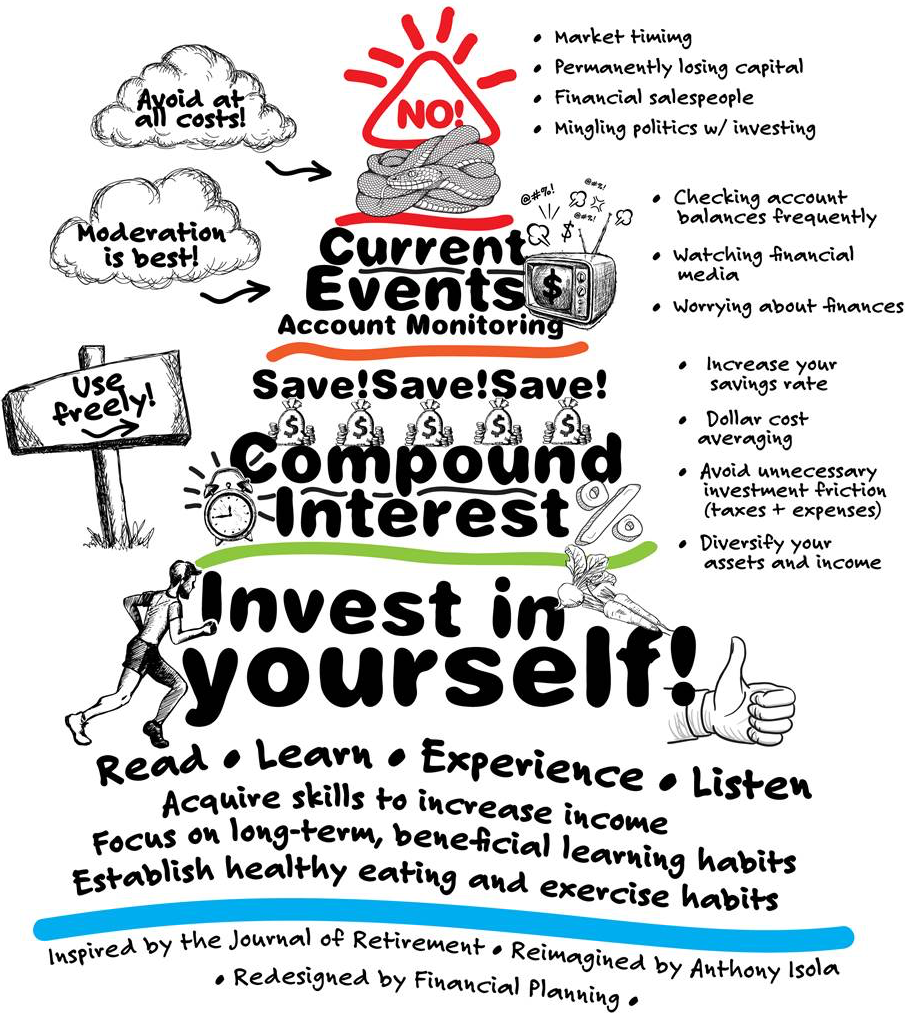
The solution is simple but not easy. Become a capitalist.
No need to make “Greed is good” your North Star. It’s a simple concept; owners earn more than employees.
Making money from savings instead of working for a paycheck is key.
There are only so many hours in the week you can work. Your money can grow 24/7.
In this case, your savings is your retirement account.
How do you make it grow?
Save, save, and save some more.
Do this through a workplace plan like a 401(k) or 403(b). Small business owners can set up their own plans. Single-K’s and Simple IRA’s are sound options for consideration.
You can also fund individual Roth and Regular IRA’s with up to $7,000 if you’re over 50.
Many investors don’t know how much to save or keep on track regarding their retirement goals.
Introducing -The Capital to Income Ratio.
Don’t freak out over these fancy terms. Capital is your retirement savings and income your salary. This number charts your progress on your transformation from laborer to capitalist.
Charles Farrell, in his terrific book, Your Money Ratios, goes into this concept in detail.
“The Capital to Income Ratio tells you how much capital you should have accumulated at various points between ages 25 and 65 so that you stay on track to reach 12 times pay at retirement.”
Farrel figured out how much you should’ve saved to reach this goal at various ages. All you need to do is multiply your current salary by the ratio indicated in the chart below.
Age Capital to Income Ratio
23 0.1
30 0.6
35 1.4
40 2.4
45 3.7
50 5.2
55 7.1
60 9.4
65 12.4
Source: Your Money Ratios
For example, if you’re 35 and you earn $80,000, your Capital to Income Ratio is 1.4. This means you should have $112,000 put away. ($80,000 x 1.4)
If your income is irregular, compute the four-year average and do the math.
This ratio helps determine if you need to save more, spend less, or retire later to reach your goals.
Having 12x your income stashed away for retirement lets you spend about 80% of your current earnings.
This number works because while employed, you were likely saving around 12% of your salary plus paying Social Security taxes. In addition to your mortgage, this left you with less than 80% of your actual income.
Having 12x income put away lets you withdraw 4-5% of your portfolio annually and adjust it to inflation. This is what most experts recommend retirees take out annually. This keeps retirees from running out of money too early in retirement.
Saving 12x your income and adding a social security benefit to the mix should allow for a comfortable lifestyle.
Fixed expenses like debt throw a monkey wrench into the plan, while a pension makes things that much better.
Of course, this relies on your money earning at least 5% or so. Most retirees need a significant slug of money invested in stocks since current bond rates are nowhere near this number.
Unpredictable variables will emerge over the next few decades. The Capital to Income Ratio is a great place to start monitoring your savings progress.
At some point, your money is going to have to work for you instead of vice versa.
Having the attitude of a capitalist will get you there sooner rather than later.
Source: Your Money Ratio by Charles Farrell