Nothing in life is free.
The last place to locate this fairy tale is in an insurance company.
Recently, we called a large insurer about the surrender fees in a Science teacher’s 403(b) variable annuity.
Besides the usual Ground Hog’s day responses, we received this beauty.
Dina inquired about the overall costs of this godforsaken product.
We do this all the time so teachers can hear the horror story directly from the horse’s mouth.
The rep told her “the M/E expense was 1.25″ but she couldn’t tell her the ratios on the underlying sub-accounts.
Except…
“The client has 35% of her money in a Guaranteed Interest Account, the good news is there are NO CHARGES FOR THIS!”
She preached on when pressed about the interest rate.
“The interest rate is 1% BUT for a while, it was 1.25%.”
“We can’t tell you what the other accounts are charging, you’ll have to call customer service for that information, sorry.”
This is after waiting over twenty minutes to hear about the wonderful virtues of her free Guaranteed Interest Account.
Let’s analyze this wonderful scenario in a more tempered manner.
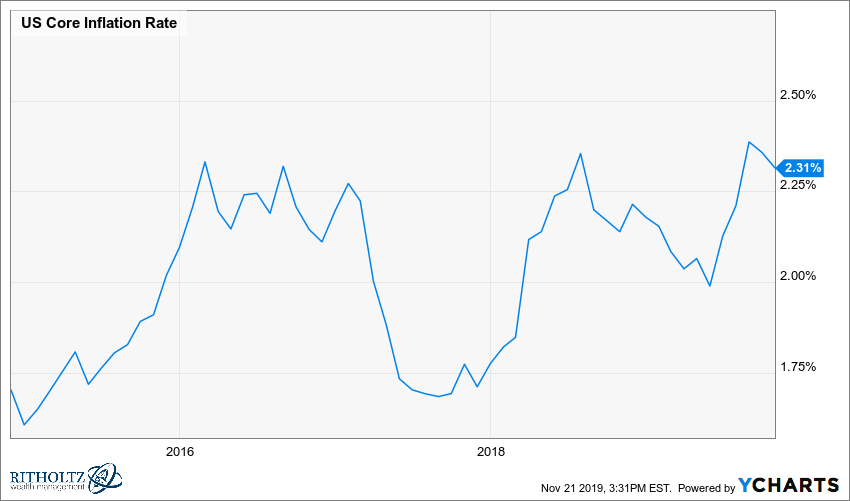
The teacher earning 1% on her free account was losing real purchasing power on a daily basis. Never mind the fact there are on-line bank accounts paying double this rate while providing FDIC insurance.
During the period she held this product, she was never anywhere close to receiving a positive real return.
Inflation is a wealth destroyer even at low levels.
The altruistic insurer was anything but. While providing this free service, they unselfishly lent the teacher’s money to others and received 2-3X the return they were paying out.
This is called an investment spread. Insurers are legally allowed to say they’re providing a zero cost investment while tremendously profiting from it
Three cheers for disclosure!
Besides this small detail, there’s something more disturbing about this allocation mix.
Why hasn’t anyone reached out to this teacher explaining that losing 1-2% a year in real purchasing power is an awful way to fund a retirement that’s two decades in the future?
Could it be because they actually make more money from their free stuff than their expensive actively managed sub-accounts?
BTW there was a 6-year rolling surrender fee to this monstrosity. Meaning, the only way the teacher could completely avoid surrender fees was to transfer the money a full six years after her last contribution.
That part was conveniently left out of the free stuff pile.
Does anyone else see the massive damage these companies are doing to the financial future of millions of public school teachers?
The SEC and NYS are currently asking this same question.
The lesson here: Beware of cheery insurance employees bearing gifts.
In the words of my colleague Barry Ritholtz, Cheap is great, but free will cost you.