Most people are visual learners. They would rather watch a video than read a 500-page book. Yes, a picture is worth a thousand words.
Teaching kids about money is no different.
Last June, Dina and I visited a Port Jefferson, N.Y. school to teach some 6th and 7th-graders investing concepts. Their teacher is very forward- thinking; she used a free program called My Classroom Economy created by Vanguard which prepped them for our visit.
We spoke about diversification, which gave us a perfect opportunity to unveil this terrific interactive market heat map – Finviz.
The interactive graphics displays the S&P 500 in a clear distinct fashion, and kids can play with it; they love to participate in hands-on lessons.
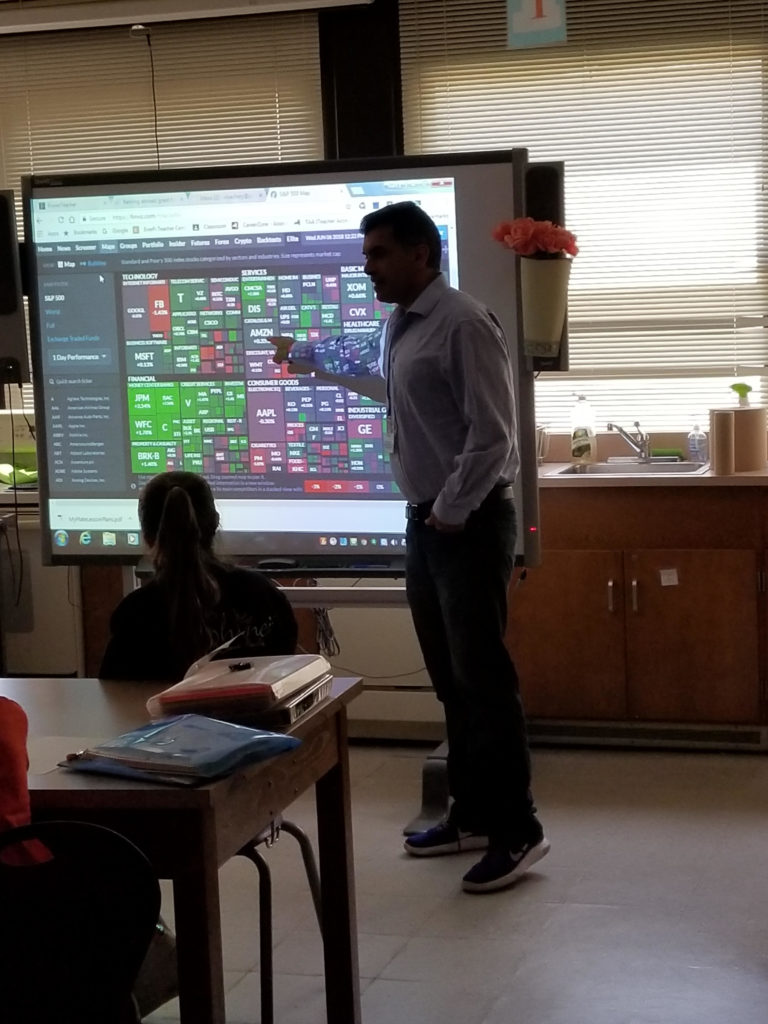
The best way to explore this graphic is to click on a company the kids already know, like Google and Apple, and dig into all the information that comes up.
The site provides an opportunity to talk about sectors and stimulates discussions about what this information means for their future selves. By looking at the growing industries, kids can begin to think about what courses of study they might want to invest in to prepare them for their professional lives. For example: The technology sector covers a pretty large part of the map; maybe there will be more career opportunities here?
The kids loved it when the prices changed. The colors helped them learn an important life lesson, it’s better to be in the green than in the red.
Finviz provides a terrific way to explain stock symbols and how large companies move market averages.
Stimulated, the kids asked some great questions:
- Why are Apple and Amazon not in the technology sector? (We are forwarding that one along to the S&P.)
- “How come I don’t see Samsung?” (This inspired an introduction to international markets, also found on the site.)
The lesson reinforced critical thinking, not rote learning, which students need more of to face the challenges of the real world.
After explaining the heat map, we posed: “Wouldn’t it be cool if there was a way to buy all of these companies with one investment?”
This was a perfect financial gateway to explain index funds.
Normally, index funds + kids = a classroom management code red. The graphics made this explanation a piece of cake. They were riveted. Students wrote down the symbols of the index funds we pointed out.
This is not a bad topic for dinner conversation when their parents ask the eye-rolling inducing question: “What did you do in school today?”
Imagine if they responded: Global capitalism is really cool and we can make a lot of money if we buy into it at 12-years-old, purchase a low-cost index fund and let compounding do its thing for 50 years.
We can dream, can’t we?
Obligatory announcements about band practice and other mundane matters interrupted our class at times. Ask a teacher what they think of these intrusions. I provided some colorfully worded responses.
“Nobody in this room is going to be a professional tuba player, listen to us and you might learn how to make some real money when you grow up.”
Their teacher liked that one. I was on a roll.
We ended things having the kids write down the website and store it in a safe place. We told them to show some adults how this works and blow their minds. Research proves people share stuff if it’s not too complex. There is nothing kids prefer more than pulling a John Hughes on authority figures.
No matter your age, teaching others is the best way to learn.
Tools like Finviz make this a lot easier.
If you are interested in bringing concepts like this into your school for 2018-2019, let us know or check out the FREE neat stuff my friends at Next-Gen Personal Finance have provided.