Experience is a good school, but the tuition can be too high. Many investors often don’t get what they pay for.
Teachers will frequently complain to us that their spouses have higher balances in their 401(k) than what is in their 403(b)s, in spite of the fact they started contributing similar amounts at roughly the same time. In addition, their asset allocations were comparable.
What gives?
A very bright teacher sent me the following data. She compared her husband’s corporate 401(k) to her own public school’s K-12 403(b) and came to a startling conclusion. In her words:
“I did a really simple analysis of my husband’s contributions and returns vs. my 403(b) contributions and returns. The results are pretty shocking:
His total contribution (including employer contribution) was $234,794
Return was $294,545
My contribution was $140,277
Return was $45,078
This is over a similar time frame. I would guess that my poor return was not due solely to the high fees, but also the quality of the product I was offered and the fees associated with those products.”
Bingo!
“In any case, it has been a useful example for me to show my colleagues who will listen :)”
Not so sure about that.
Fees matter. A LOT! Assuming a $100,000 investment and a 6% annual return, the results from this Vanguard chart* spanning 25 years verify her “back of the envelope” analysis.
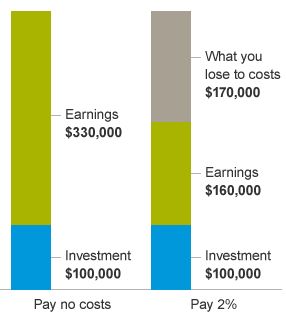
Sadly this is what happens when one spouse has the option of using low-cost index funds while the other is left with an expensive variable annuity. This illustrates the dramatic effect when one retirement plan has rules that make employers look at investment fees, and the other doesn’t.
Multiply this number by a few million people and you can see how investors are annually overcharged to the tune of $17 billion.
Barron’s recently came out with an article, “In Fund Management, Winning Trends Persist,” and they ranked the criterion that leads to superior mutual fund returns. It is no surprise that low fees are at the top of the list.
Here is their take: “Cheap funds soar; expensive funds flounder. Fees are the most reliable indicator of fund performance. Russ Kinnel, director of manager research at Morningstar, found that 62% of U.S. equity funds in the lowest quintile for fees beat their benchmark from 2010 to 2015. That compared with 20% in the highest-cost quintile, confirming findings from earlier periods.”
Conversely, as my teacher friend so rudely found out:
“While funds with low costs are an impressively good bet, funds with high costs are an impressively bad bet.”
Many discover this after it is too late. Decades of valuable compounding are needlessly thrown into the trash bin. These years can never be recovered. Worse, these dollars were a massive wealth transfer from a person’s retirement account directly into the pockets of conflicted financial salespeople.
People complain about the high cost of tuition for private universities. These figures pale in comparison to the enormous expense for investors who learn the hard way about high-fee investments.
School yourself before this happens.
We are here to help. Our firm sells knowledge, not products.
Your spouse is most likely not an investing genius. He/she just happens to have access to low- cost investments.
We can make these available to you on your 403(b) platform.
In the words of Rick Ferri, “There are risks, there is return, and there are costs, all else is marketing.”
The cost of falling for investment marketing over low fees is the most expensive tuition you will ever pay.
* Source: Vanguard. This chart shows how investment costs can eat away at your savings. If you have $100,000 invested, it could grow to $430,000 without any investment costs. But if you pay only 2% a year in costs, it could grow to only $260,000. You would lose about $170,000 to costs. This hypothetical illustration doesn’t represent any particular investment nor does it account for inflation. “What you lose to costs” represents both the amount paid in expenses as well as the “opportunity costs”—the amount you lose because the costs you paid are no longer invested. There may be other material differences between investment products that must be considered prior to investing. Numbers are rounded.